Back to success stories
Boosting Auto Insurance Customer Retention
The Challenge
A top 5 auto insurance carrier wanted to evaluate if Powerlytics proprietary database of over 3,000 consumer financial data variables and data transformations could improve their existing customer retention model.
The ability to identify profitable customers that are likely to let their policy lapse and implement customer retention strategies to keep them is less costly than having to obtain new customers.
They also believed that if they could predict the retention rate of a prospect, they could deploy more effective targeting and product selection strategies at the new business stage.
Unfortunately, since their current predictive model contains internal policy variables that are not available at time of quote, they could not predict a prospect’s retention rate or target customers likely to stay longer.
The Solution
The insurance carrier built two additional retention models, one using only Powerlytics variables and one combining its current model of customer and other date with the Powerlytics data.
We provided the Top 5 insurance carrier with nearly 3,000 consumer financial data variables and their data transformations. The variables were tested and over 30 Powerlytics variables were highly correlated with customer retention.
The following is a small sample of the 30 predictive variables:
- 3-year % change in Average number of returns filed as single
- 1-year % change in Average Disposable Income
- Wealth Income / Adjusted Gross Income
- Business Income / Adjusted Gross Income
The two new predictive models were then evaluated to determine if they would improve the ability to predict current customer retention compared to their current model and whether the Powerlytics variables alone would be an effective solution for targeting prospects likely to become long-term customers.
The Impact
To assess the value of each model, the Top 5 carrier used an Area Under the ROC Curve (AUC) metric. The AUC metric, a number from 0 to 1, measures how well a predictive model is able to rank order actual outcomes. The higher the AUC metric, the more effective the predictive model.
The AUC metrics of the three models are as follows: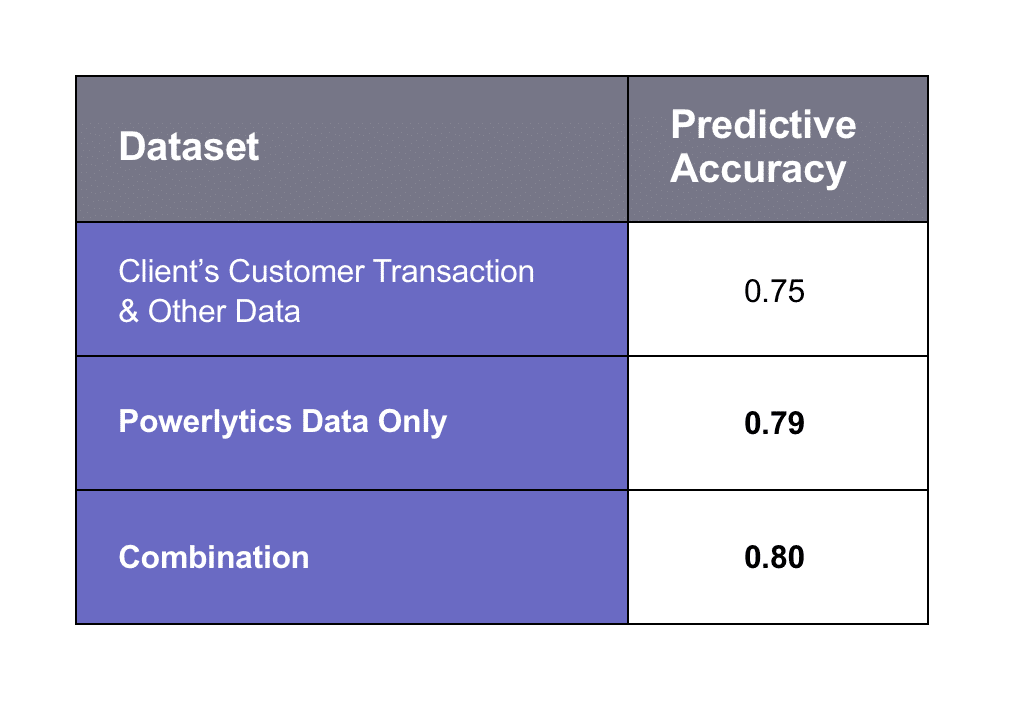
As the chart illustrates, both the model with “Powerlytics Data Only” and the “Combination” model outperformed the current model. Since Powerlytics variables are available at time of quote, the model built using “Powerlytics Data Only” could be applied to prospects as well as current customers.
By using Powerlytics data, not only does the Top 5 carrier now have an improved model for their current book of business, but they can also do the following:
✓ Understand new customers likely to leave (e.g. short-term customer) and adjust the customer strategy during onboarding.
✓ Better target customers that are likely to stay.
✓ Retain customers that are likely to leave through targeted retention strategies.
A small percentage improvement in models like this can make a significant difference in the ability to identify customer churn and improve profitability.
Read next